Drupal core is pretty well optimized. But after you've finished building your Drupal 7 or 8 site, you might find some pages are loading slower than you'd like. That's not surprising—you've probably enabled scores of contrib modules, written custom code, and are running over 100 SQL queries per uncached request.
But how to diagnose and fix a backend performance problem like this? Do you need to buy a beefier server, drop some features, or add a fancy caching layer? This blog post will introduce a great new tool called Blackfire that makes it much easy to profile your code and find the bottleneck. We've found that it finds easy optimizations so often that it's become an essential part of our pre-deployment checklist.
Our first profile
On a recent project we delivered for AllSeen Alliance, there was a view that was unusually slow. I've reproduced something similar on a clean Drupal 7 site, where we have a list of articles:
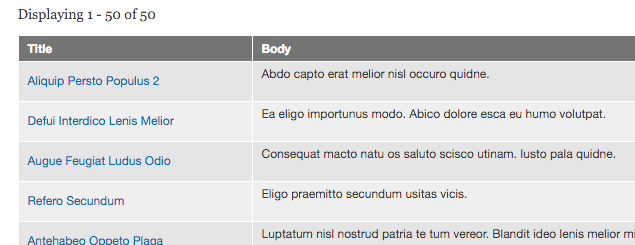
We notice it feels sluggish compared to other views on the same site. We popped open Chrome's DevTools' Network tab to investigate the exact timing. Filtering by "Doc" (to hide all the static assets info), we see that the HTML page took 172ms to render and download.

This is actually actually pretty fast for a Drupal loading time. But since it's on a clean D7 site (hardly any contrib modules), the other views seem to take around 50ms. What's going on here?
At this point, we will install and use a PHP profiler to show us what part of the code is taking so long. After considering other tools like xhprof), we settled on blackfire.io, which is much easier to install and use, has a nice GUI, and is free for the basic use case. Due to their excellent installation docs and GitHub integration, it took us just 5 minutes to get it running in dev.
Next we install the blackfire.io Companion Chrome Extension and visit the page we want to profile. Click on the extension's toolbar icon to kick off the profiling, taking advantage of the "Create New Reference" feature to mark the current profile as a baseline, which will be compared against future runs:
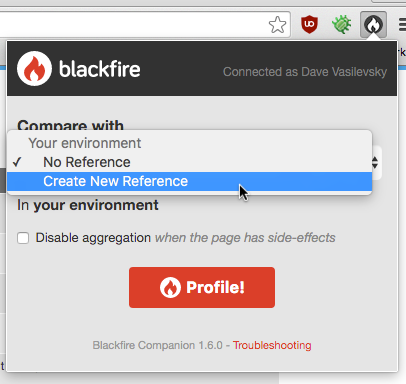
Blackfire will now fetches the page ten times, averages the results (to reduce variability and warm the caches), and upload the profile to their servers. It will be then display the result as function call profile visualized as a snazzy call graph! Checkout the screenshot, or better yet take a minute to play with it live on the Blackfire site:
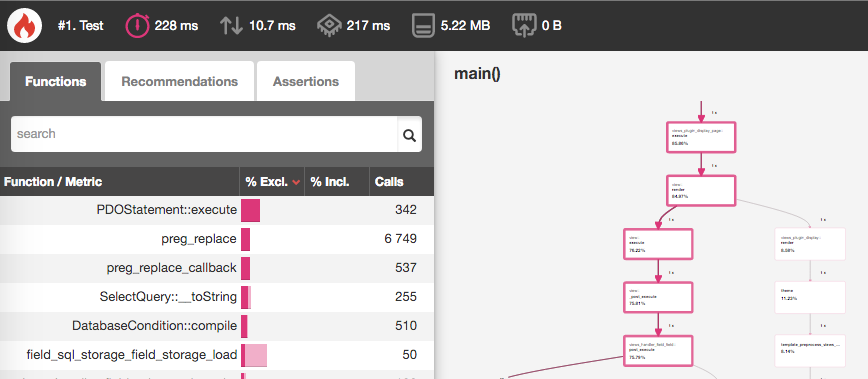
What does it mean? For a complete description, see this page in the Blackfire documentation, but here are the key parts:
- The alarm-clock in the top-left corner means the page took 228 milliseconds to deliver, including any profiling overhead. That's too long for a simple page!
- On the right is a graph of all the function calls, connected to their parents and children. The red outlines indicate the Hot Path, where most of the time is being spent.
Profile analysis
Looking closer, we see that the hot path for this page involves entity_load:
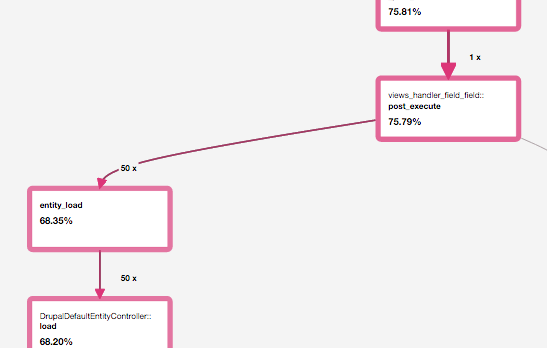
You might recall that the view in question rendered 50 items, and the profile shows that entity_load() function was called 50 times, which seems pretty reasonable. So why is it so slow? It occurred to us to create another simple view that shows 50 nodes, without all the fields and relationships.
We visit that page, activate the blackfire.io extension, and ask it to compare it to the reference profile we saved earlier. As we look at the profile comparison, we can see that the number of calls to entity_load() has decreased by forty-nine! In the simpler view, entity_load() is called only once for all 50 items.
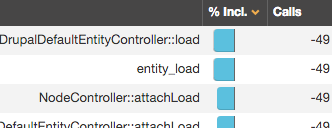
Looking at the call graph, we surmise that the surrounding function, views_handler_field_field::post_execute(), must be calling entity_load() differently somehow. Reading the the relevant code in views_handler_field_field.inc we see following:
// Load the entities.
// ...
if (empty($this->definition['is revision'])) {
  $entities = entity_load($entity_type, $entity_ids);
  // ...
}
else {
  // Revisions can't be loaded multiple, so we have to load them
  // one by one.
  foreach ($entity_ids as $key => $combined) {
    // ...
    $entity = entity_load($entity_type, array($entity_id), array($entity_info['entity keys']['revision'] => $revision_id));
    // ...
  }
}
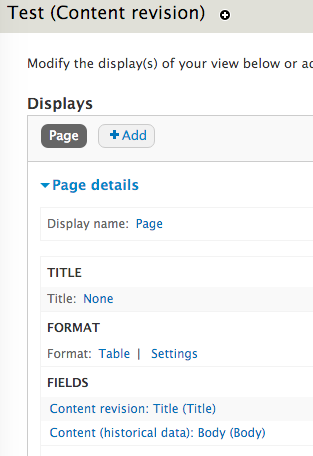
Aha! Usually, it will call entity_load() with many IDs at once, but the comment "Revisions can't be loaded multiple, so we have to load them one by one" suggests that our problematic view might be pulling in revisions. And indeed, when the view settings page confirms this, since its title is "Test (Content revision)", not "Test (Content)":
Fixing it
In our case the fix turned out simple, just get rid of the revisions. Due to scope changes, the view originally needed to be over revisions, but not anymore. So we just recreated the view over unrevisioned nodes, and hope that the problem is fixed.
But we can't just assume that the problem is fixed, we always have to test. So let's do another comparison profile. Blackfire confirms that our view now takes just 83ms (including overhead). That's a huge improvement. It also shows us that the improvement came from entity_load() and related functions, confirming that our fix is really doing what we thought:
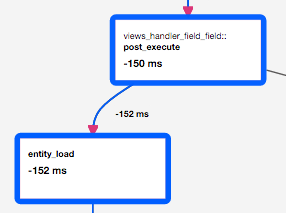
Now we can sleep easy at night, knowing that our page loads quickly.
Learning more
We'll be giving a talk at DrupalCon New Orleans in May, with lots more information about using Blackfire to profile Drupal sites. You can also sign up for Blackfire yourself and get started profiling your sites right now!
Let me know what you discover at @djvasi, and also tell me what you'd like to hear about at DrupalCon.

